<cfscript>
// ChartDirector for ColdFusion API Access Point
cd = CreateObject("java", "ChartDirector.CFChart");
// A utility to allow us to create arrays with data in one line of code
function Array() {
var result = ArrayNew(1);
var i = 0;
for (i = 1; i LTE ArrayLen(arguments); i = i + 1)
result[i] = arguments[i];
return result;
}
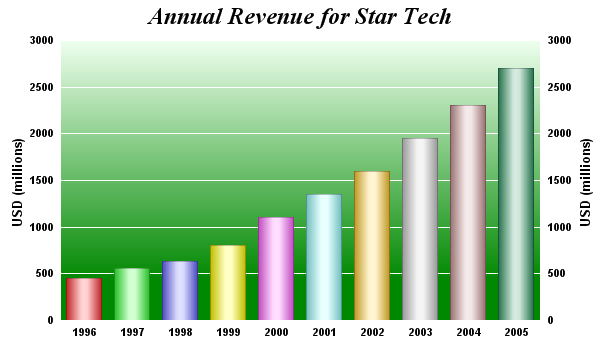
// The data for the bar chart
data = Array(450, 560, 630, 800, 1100, 1350, 1600, 1950, 2300, 2700);
// The labels for the bar chart
labels = Array("1996", "1997", "1998", "1999", "2000", "2001", "2002", "2003",
"2004", "2005");
// Create a XYChart object of size 600 x 360 pixels
c = cd.XYChart(600, 360);
// Add a title to the chart using 18pts Times Bold Italic font
c.addTitle("Annual Revenue for Star Tech", "Times New Roman Bold Italic", 18);
// Set the plotarea at (60, 40) and of size 480 x 280 pixels. Use a vertical gradient
// color from light green (eeffee) to dark green (008800) as background. Set border
// and grid lines to white (ffffff).
c.setPlotArea(60, 40, 480, 280, c.linearGradientColor(60, 40, 60, 280, "0xeeffee",
"0x008800"), -1, "0xffffff", "0xffffff");
// Add a multi-color bar chart layer using the supplied data. Set cylinder bar shape.
c.addBarLayer3(data).setBarShape(cd.CircleShape);
// Set the labels on the x axis.
c.xAxis().setLabels(labels);
// Show the same scale on the left and right y-axes
c.syncYAxis();
// Set the left y-axis and right y-axis title using 10pt Arial Bold font
c.yAxis().setTitle("USD (millions)", "Arial Bold", 10);
c.yAxis2().setTitle("USD (millions)", "Arial Bold", 10);
// Set all axes to transparent
c.xAxis().setColors(cd.Transparent);
c.yAxis().setColors(cd.Transparent);
c.yAxis2().setColors(cd.Transparent);
// Set the label styles of all axes to 8pt Arial Bold font
c.xAxis().setLabelStyle("Arial Bold", 8);
c.yAxis().setLabelStyle("Arial Bold", 8);
c.yAxis2().setLabelStyle("Arial Bold", 8);
// Output the chart
chart1URL = c.makeSession(GetPageContext(), "chart1");
// Include tool tip for the chart
imageMap1 = c.getHTMLImageMap("", "", "title='Year {xLabel}: US$ {value}M'");
</cfscript>
<html>
<body style="margin:5px 0px 0px 5px">
<div style="font-size:18pt; font-family:verdana; font-weight:bold">
Cylinder Bar Shading
</div>
<hr style="border:solid 1px #000080" />
<cfoutput>
<div style="font-size:9pt; font-family:verdana; margin-bottom:1.5em">
<a href='viewsource.cfm?file=#CGI.SCRIPT_NAME#'>View Source Code</a>
</div>
<img src="getchart.cfm?#chart1URL#" usemap="##map1" border="0" />
<map name="map1">#imageMap1#</map>
</cfoutput>
</body>
</html> |